Log in to your Inderes Free account to see all free content on this page.
Meriaura Group
0.045 EUR -1.74%4,463 investors are following this company
Meriaura Group has two business areas: Maritime Logistics and Renewable Energy. Meriaura transports dry cargo and executes demanding project deliveries in Northern Europe. The company offers CO2 reducing marine transport services based on the use of recycled, in-house produced bio-oil. Meriaura Energy designs and delivers clean energy production solutions for district heating and industrial use worldwide, with Europe as the main market area.
P/E (24e)
22.24
EV/EBIT (adj.) (24e)
16.2
P/B (24e)
0.96
Dividend yield-% (24e)
-
Target price
0.04 EUR
Recommendation
Reduce
Updated
1.3.2024
First North Finland
MERIH
Daily low / high price
0.043 / 0.048
EUR
Market cap
39.18M EUR
Turnover
24.54K EUR
Volume
538K
Risk and recommendation
HighRiskLow
SellRecommendationBuy
Log in to see the recommendation and risk by Inderes
Latest research
Extensive report
Inderes' extensive report is an investor's handbook on customer companies covered by our research.
The latest extensive report was released
Read the reportAnalyst

Pauli Lohi
Analyst
Financial calendar
General meeting
03.05.2024
Business review
03.05.2024
Interim report
22.08.2024
Business review
31.10.2024
Major OwnersSource: Millistream Market Data AB
| Owner | Capital | Votes |
|---|---|---|
| Meriaura Invest Oy | 61.2 % | 61.2 % |
| Hybrid Consulting Oy | 3.9 % | 3.9 % |
Premium
This content is for our Premium customers only.
Insider Transactions
| Insider | Date | Total value |
|---|---|---|
| Repo Eljas | 30.03.2023 | 33,937SEK |
| Eero Kalevi Auranne | 27.03.2023 | 347EUR |
Premium
This content is for our Premium customers only.
Forum updates
Income statement
| 2020 | 2021 | 2022 | 2023 | 2024e | 2025e | 2026e | 2027e | |
|---|---|---|---|---|---|---|---|---|
| Revenue | 5.1 | 2.5 | 8.6 | 66.2 | 78.5 | 85.2 | 94.8 | 101.9 |
| growth-% | 49.8 % | -51.2 % | 245.8 % | 666.5 % | 18.6 % | 8.6 % | 11.2 % | 7.6 % |
| EBITDA | -3.4 | -4.2 | -3.6 | 6.3 | 8.7 | 9.8 | 11.6 | 12.7 |
| EBIT (adj.) | -3.9 | -4.6 | -3.8 | 1.0 | 3.3 | 4.2 | 5.7 | 6.6 |
| EBIT | -3.9 | -4.6 | -3.8 | 1.0 | 3.3 | 4.2 | 5.7 | 6.6 |
| Profit before taxes | -5.0 | -5.8 | -4.1 | -0.3 | 2.0 | 3.2 | 4.7 | 5.6 |
| Net income | -5.0 | -5.8 | -4.1 | -0.3 | 1.8 | 3.0 | 4.5 | 5.4 |
| EPS (adj.) | -0.08 | -0.03 | -0.01 | -0.00 | 0.00 | 0.00 | 0.01 | 0.01 |
| growth-% | 67.7 % | 48.9 % | 19.6 % | |||||
| Dividend | 0.00 | 0.00 | 0.00 | 0.00 | 0.00 | 0.00 | 0.00 | 0.00 |
| Dividend ratio |
Login required
This content is only available for logged in users
Profitability and return on capital
| 2020 | 2021 | 2022 | 2023 | 2024e | 2025e | 2026e | 2027e | |
|---|---|---|---|---|---|---|---|---|
| EBITDA-% | -66.6 % | -167.2 % | -41.4 % | 9.6 % | 11.1 % | 11.5 % | 12.2 % | 12.5 % |
| EBIT-% (adj.) | -76.2 % | -182.4 % | -43.6 % | 1.6 % | 4.2 % | 5.0 % | 6.0 % | 6.4 % |
| EBIT-% | -76.2 % | -182.4 % | -43.6 % | 1.6 % | 4.2 % | 5.0 % | 6.0 % | 6.4 % |
| ROE | -120.6 % | -103.4 % | -19.4 % | -0.7 % | 4.4 % | 7.0 % | 9.6 % | 10.4 % |
| ROI | -77.7 % | -76.2 % | -12.0 % | 1.8 % | 5.3 % | 6.4 % | 8.3 % | 9.0 % |
Login required
This content is only available for logged in users
Valuation
| 2020 | 2021 | 2022 | 2023 | 2024e | 2025e | 2026e | 2027e | |
|---|---|---|---|---|---|---|---|---|
| Share price (EUR) | 0.14 | 0.05 | 0.07 | 0.05 | 0.05 | 0.05 | 0.05 | 0.05 |
| Shares | 62.9 | 165.2 | 783.1 | 886.8 | 886.8 | 886.8 | 886.8 | 886.8 |
| Market cap | 9.0 | 7.9 | 54.8 | 43.5 | 40.1 | 40.1 | 40.1 | 40.1 |
| Enterprise value | 7.0 | 4.1 | 71.5 | 56.8 | 53.4 | 52.7 | 51.2 | 48.7 |
| EV/S | 1.4 | 1.6 | 8.3 | 0.9 | 0.7 | 0.6 | 0.5 | 0.5 |
| EV/EBITDA | - | - | - | 9.0 | 6.1 | 5.4 | 4.4 | 3.8 |
| EV/EBIT (adj.) | - | - | - | 54.4 | 16.2 | 12.4 | 8.9 | 7.4 |
| EV/EBIT | - | - | - | 54.4 | 16.2 | 12.4 | 8.9 | 7.4 |
| P/E (adj.) | - | - | - | - | 22.2 | 13.3 | 8.9 | 7.4 |
| P/E | - | - | - | - | 22.2 | 13.3 | 8.9 | 7.4 |
| P/B | 1.9 | 1.2 | 1.5 | 1.1 | 1.0 | 0.9 | 0.8 | 0.7 |
| P/S | 1.8 | 3.2 | 6.3 | 0.7 | 0.5 | 0.5 | 0.4 | 0.4 |
| Dividend yield | ||||||||
| Equity ratio | 66.2 % | 79.5 % | 55.0 % | 58.9 % | 58.1 % | 59.4 % | 61.4 % | 64.6 % |
| Gearing ratio | -41.9 % | -58.8 % | 47.2 % | 33.3 % | 31.8 % | 28.1 % | 22.6 % | 15.7 % |
Login required
This content is only available for logged in users
Quarter data
| Q1/23 | Q2/23 | Q3/23 | Q4/23 | 2023 | Q1/24e | Q2/24e | Q3/24e | Q4/24e | |
|---|---|---|---|---|---|---|---|---|---|
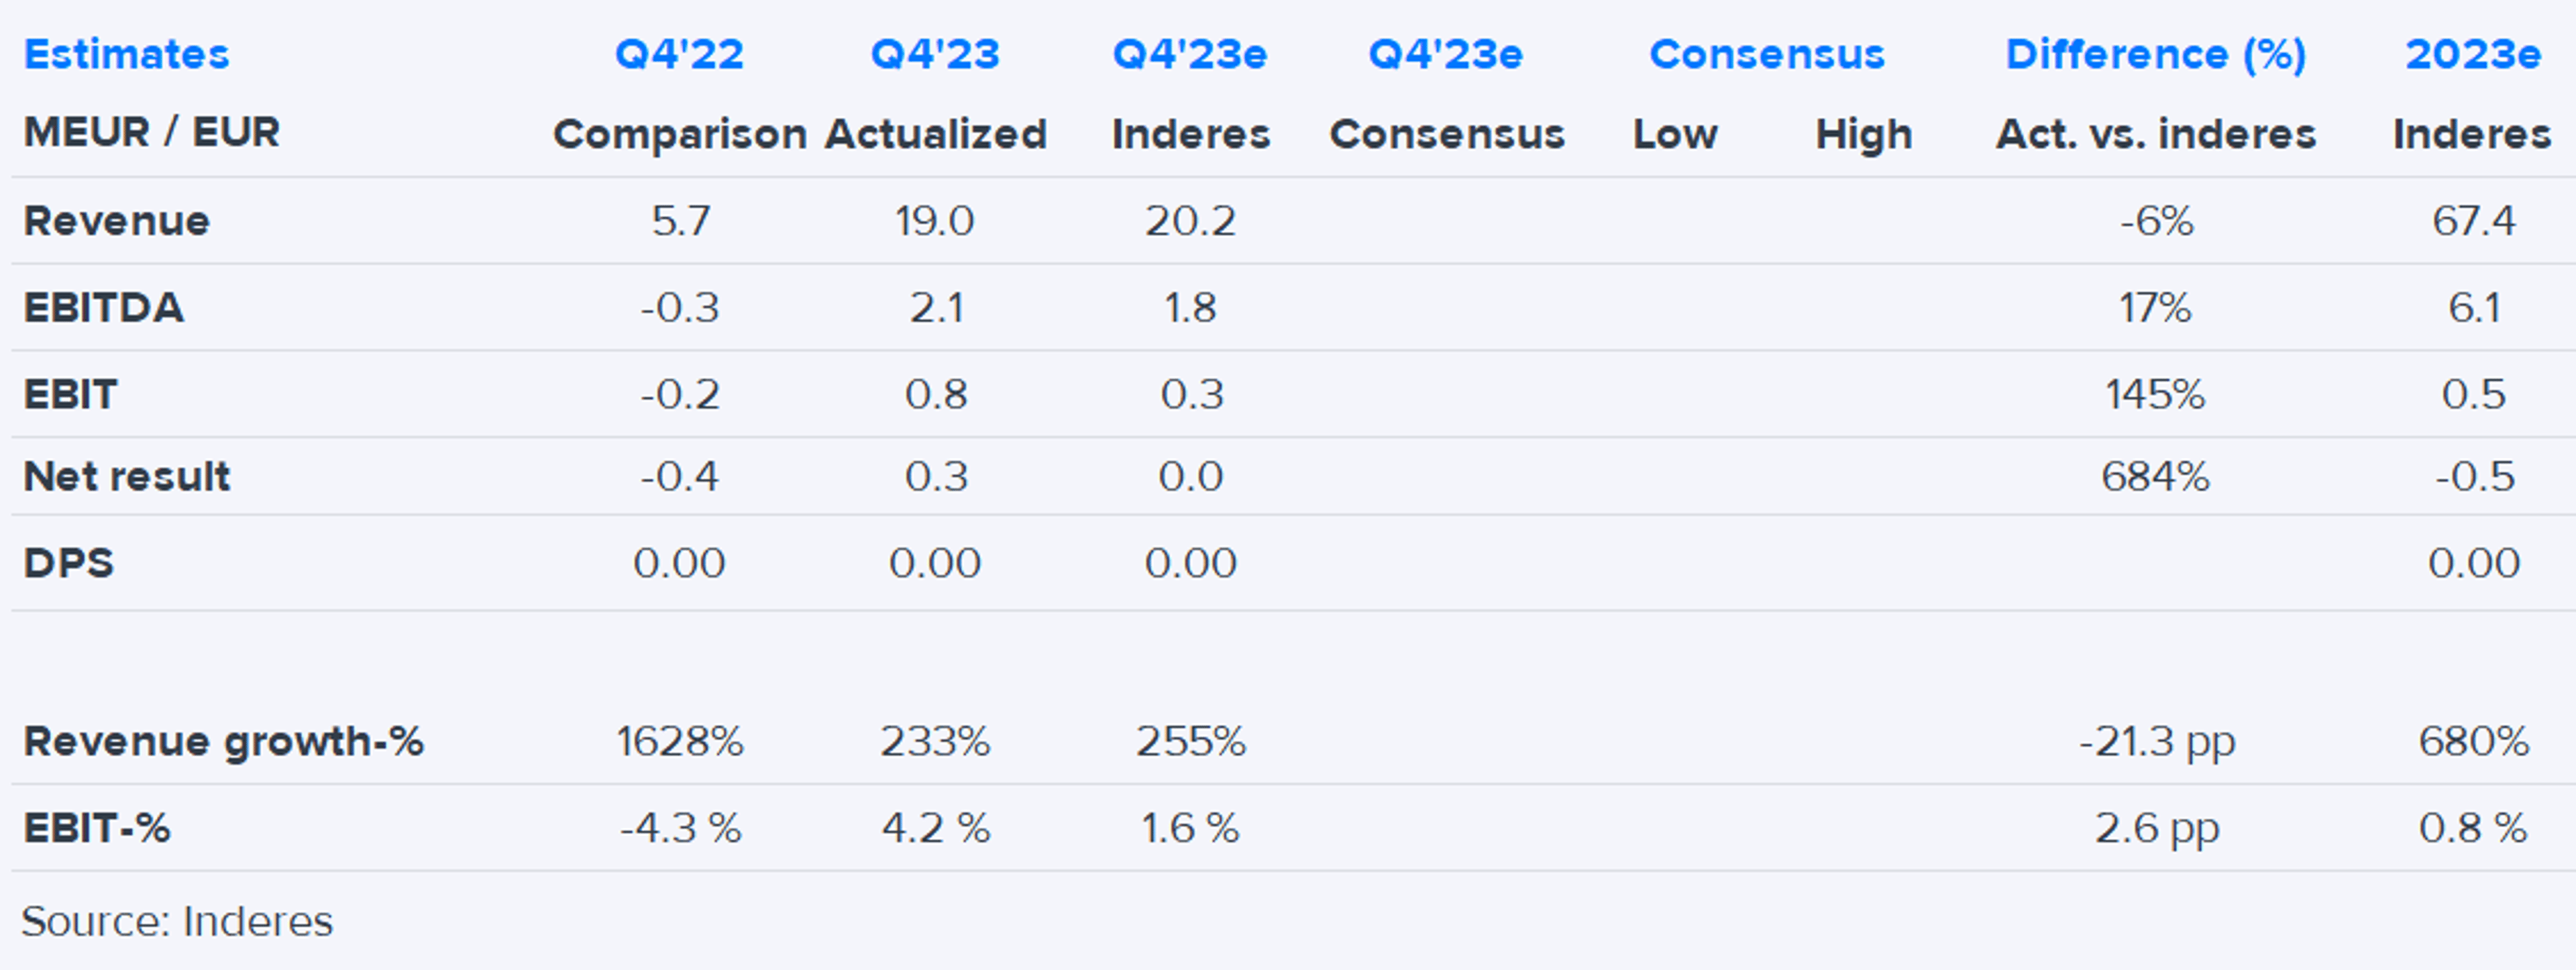
| Revenue | 16.2 | 15.3 | 15.7 | 19.0 | 66.2 | 18.3 | 19.2 | 18.7 | 22.3 |
| EBITDA | 1.5 | 1.1 | 1.7 | 2.1 | 6.3 | 1.9 | 2.1 | 2.0 | 2.7 |
| EBIT | 0.2 | -0.2 | 0.3 | 0.8 | 1.0 | 0.5 | 0.7 | 0.6 | 1.5 |
| Profit before taxes | -0.1 | -0.5 | 0.0 | 0.2 | -0.3 | 0.3 | 0.4 | 0.4 | 0.9 |
| Net income | -0.1 | -0.5 | 0.0 | 0.3 | -0.3 | 0.2 | 0.4 | 0.3 | 0.9 |
Login required
This content is only available for logged in users
ShowingAll content types
Small but interesting solar thermal project in France for Meriaura Group
Inside information: Meriaura Energy signs a contract with Serres Vermeil SARL to deliver a solar thermal plant in Palau-del-Vidre, France
Join Inderes community
Don't miss out - create an account and get all the possible benefits
FREE account
Stock market's most popular morning newsletter
Analyst comments and recommendations
Stock comparison tool
PREMIUM account
All company reports and content
Premium tools (e.g. insider transactions & stock screener)
Model portfolio